 I'm teaching regression right now and a question that comes up a lot is how an intercept can be negative when the outcome has a range of scores of something like a grade on a vocabulary test in percent correct (0-100%). Worse, sometimes the regression suggests that the negative intercept is significantly different from zero! Can we really conclude that there are people who got a negative score on a vocabulary test?
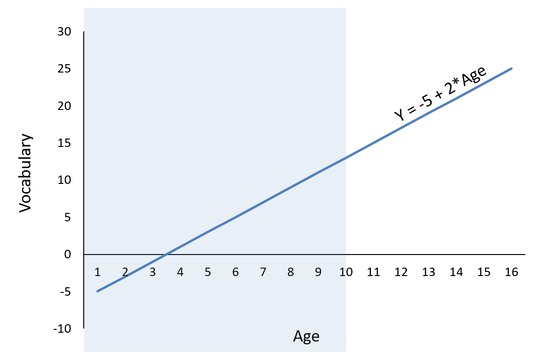
Regression is based around the idea of model comparisons; where models with added predictors are compared to an unconditional model (a model with no predictors) to determine if better fit has been achieved. In the unconditional model, each person’s observed score on the Y (the outcome) is always equal to the mean of Y (represented as B0) plus error: Y = B0 + e Because B0 is equal to the mean of Y, in our hypothetical example of percentage correct on a final test, the intercept will never be negative. It could be really small if your class of students absolutely bombed their test, but it won't ever be negative. But we don't really ever interpret unconditional models. In a regression, you will always have at least one predictor. We add a predictor in an attempt to make the error smaller. In other words, we attempt to explain more of the error, and better fit the observed data points. So let's suppose that my vocabulary test is completed by 200 students, aged 10-15. I generally expect that older children will have larger vocabularies (and thus, higher scores on this vocabulary test). When we add a predictor to this equation, it is now a conditional model. In regression, the conditional model predicting vocabulary from age will look like this: Y = B0 + B1*age + e Where Y = the expected vocabulary score for someone who is zero years old. Why for someone who is zero? Because if the x-value plugged in for age is zero, then the weight (B1) is reduced to zero, and so Y = B0. The key phrase here is “someone who is zero years old” because it is what makes the expected score of Y conditional. The expected value of Y (and so the estimate of B0, which is also called the Y-intercept or often just “intercept”) is always equal to the mean of Y when all predictors are zero. So in our hypothetical example, our age variable ranges from 10-16, and so does not include zero. If the age coefficient is significantly positive, there's a strong possibility that the intercept may be negative. Inventing some results, I graphed them at the right: With the equation Y = -5 + 2* Age. Here I've estimated that a 10 year old has an expected vocabulary score of 15, and that every year age increase corresponds to an expected 2 point increase in vocabulary score. That means we have a negative intercept (B0 = -5). The negative intercept is completely possible, because we are trying to estimate the vocabulary score of... a newborn baby. The whole shaded part of that figure represents a place on the distribution where we don't have any data. So. Only interpret your intercept, negative or not, when the zero point lies within the observed range of your data. If it doesn't, you have two choices. 1) Don't interpret it, just ignore it. or 2) re-center your predictors so that they all do contain your zero point, and now you can interpret the intercept. What's centering? We'll do that another day.
0 Comments
Leave a Reply. |
Archives
June 2022
Categories |
 RSS Feed
